 Rawboard
How to use the list
There are no universal “good” values: a small practice and a shop in a mall have different reference points. That is why I give no thresholds. Your benchmark is your own history: compare this month with last month and with the same month last year, if you have the data. If you need the Excel steps, they are in How to build a sales report from Excel.
1. Sales, per period and against the previous period
Formula: the sum of sales value in a month and the percentage change against the previous month.
Where: the “value” column in the export, grouped by month.
How to read it: compare months with the same number of days or look at the daily average, otherwise a 31-day month looks better than a 28-day one. See comparing two months.
2. Average order value
Formula: total sales ÷ number of orders (or receipts).
Where: the value and the number of orders in the export.
How to read it: if it falls while sales rise, you sell more but in smaller orders. If it rises, customers choose more options per order.
3. Category mix: frames, lenses, accessories
Formula: each category’s value ÷ total sales.
Where: the “category” or “product” column.
How to read it: it shows where the money comes from. A sudden change in the mix (for example, more cheap frames) explains why the average order value moved.
4. How many lens orders include coatings or upgraded versions
Formula: orders with a coating (anti-reflective, filter, thin lenses, photochromic) ÷ orders with lenses.
Where: the lens-type or coating column, if your software exports it.
How to read it: it reflects how well you explain the options (see How to explain lens differences to customers). Compare between consultants, without drawing conclusions from a single month.
5. Conversion: consultations → orders
Formula: orders ÷ consultations (or customers who walked in), for the same period.
Where: consultations and orders from the reports; if you do not have visitor numbers, use consultations.
How to read it: a low conversion can mean problems with explanation, offer or price. Follow the trend, not one month’s value.
6. Remakes and complaints
Formula: remade or complained-about orders ÷ total orders.
Where: if the software flags remakes; if not, keep a simple monthly list.
How to read them: a low, stable percentage means a good process; a rise calls for a search for the cause (measurements, fitting, supplier). Complement with direct customer feedback (satisfaction survey).
7. Sales per consultant and per weekday
Formula: sales per salesperson ÷ total sales; sales per weekday.
Where: the “salesperson” and “date” columns.
How to read them: differences per salesperson depend on schedule, hours and type of customers: compare under similar conditions. Weekdays help you plan the team’s schedule.
How to track them without the effort
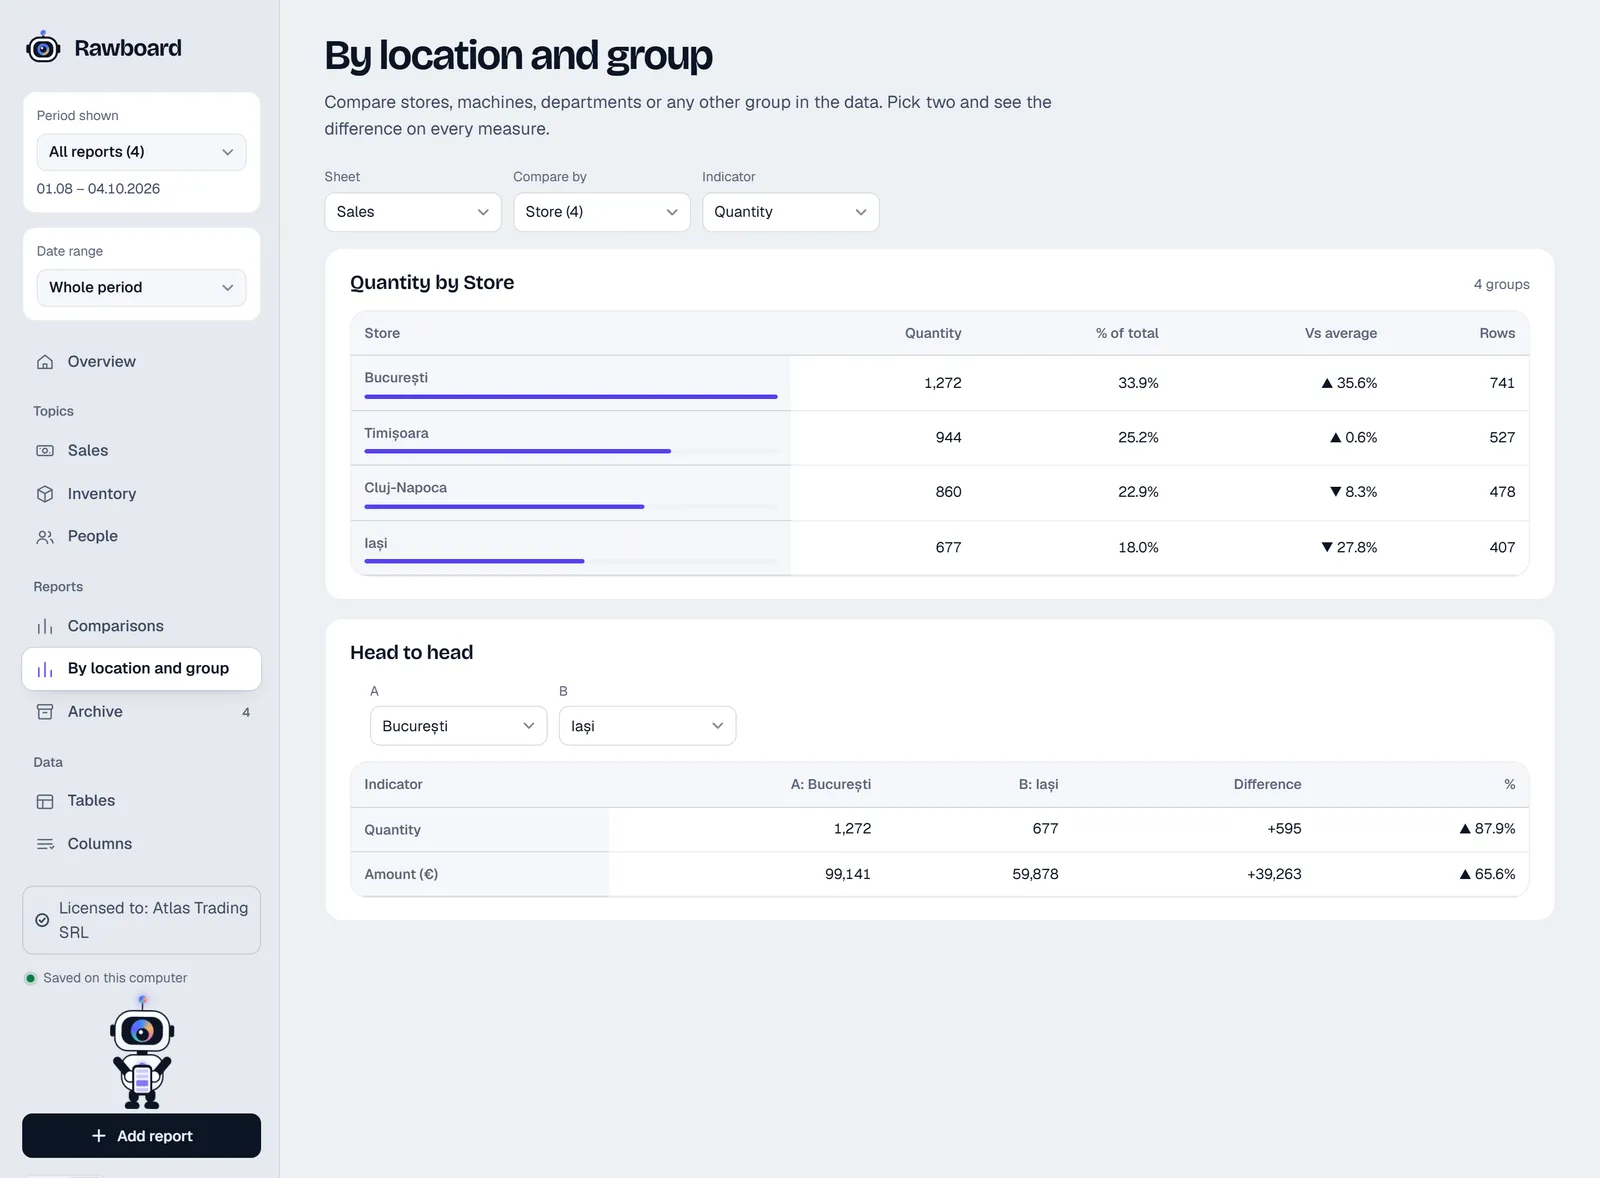
You can do it all in Excel, but it takes time at every month-end. Rawboard reads the export and shows you sales by day, category and salesperson, compares two months, ranks locations and groups and lets you define alerts (for example: “tell me how many rows have stock below 20”). It runs offline, so your company data stays with you.
Frequently asked questions
Which indicator should I track if I only have time for one?
What is a good average order value in an optical store?
My software does not export coatings. What do I do?
How often should I look at them?
Sources and further reading

Optometrist with over ten years in medical optics. Writes about what works in a real practice or shop, and builds the apps that daily work called for.
About the author Vantage