 Rawboard
What you actually compare
For each indicator (sales value, number of orders, units sold) you want three numbers:
- The absolute difference: month B minus month A.
- The percentage change: the difference ÷ the earlier month.
- The change per day: the same figures, divided by the number of days in each month. That is where the truth shows when months differ in length.
An example with figures
Fictional example, with sample data: September (30 days) against August (31 days).
| Indicator | September (30 days) | August (31 days) | Difference | Change | Change per day |
|---|---|---|---|---|---|
| Transactions | 1,069 | 1,084 | −15 | ▼ 1.4% | ▲ 1.9% |
| Sales value | 685,830 lei | 734,661 lei | −48,831 lei | ▼ 6.6% | ▼ 3.5% |
| Units sold | 1,878 | 1,875 | +3 | ▲ 0.2% | ▲ 3.5% |
You can see why “per day” matters: for transactions the month looks weaker (−1.4%), but per day it is better (+1.9%). For units, about the same in total (+0.2%), but per day up 3.5%. Only sales value stays lower per day too (−3.5%), so that is where to look for a cause: a smaller average order, a different mix?
The traps of comparison
- Month length. Compare per day, or months with the same number of days.
- Days of the week. A month with five Saturdays usually sells differently from one with four. If you have history, compare with the same month last year.
- Holidays and leave. A month with public holidays or a colleague on leave is not comparable 1:1.
- Overlapping periods. If you add two exports that cover the same days, sales double.
- Total rows. If the export has a total at the end, you count it once too many.
How to do it in Excel
- Put the two months in two columns, with the same rows (indicators).
- The difference:
=B2-A2. The percentage:=(B2-A2)/A2. - Per day: divide each month by its number of days, then calculate the percentage.
- Check the totals against the original export.
That is enough for a few indicators. When you have dozens, it becomes repetitive.
How Rawboard does it
In Rawboard you keep reports in an archive on your computer: each report stays saved with its period, common days are never counted twice, and a file added twice is recognised. You pick report A and report B and get the difference, the percentage change, the change per day (when periods differ in length) and day-by-day charts. It also compares the daily average, which avoids the trap above.
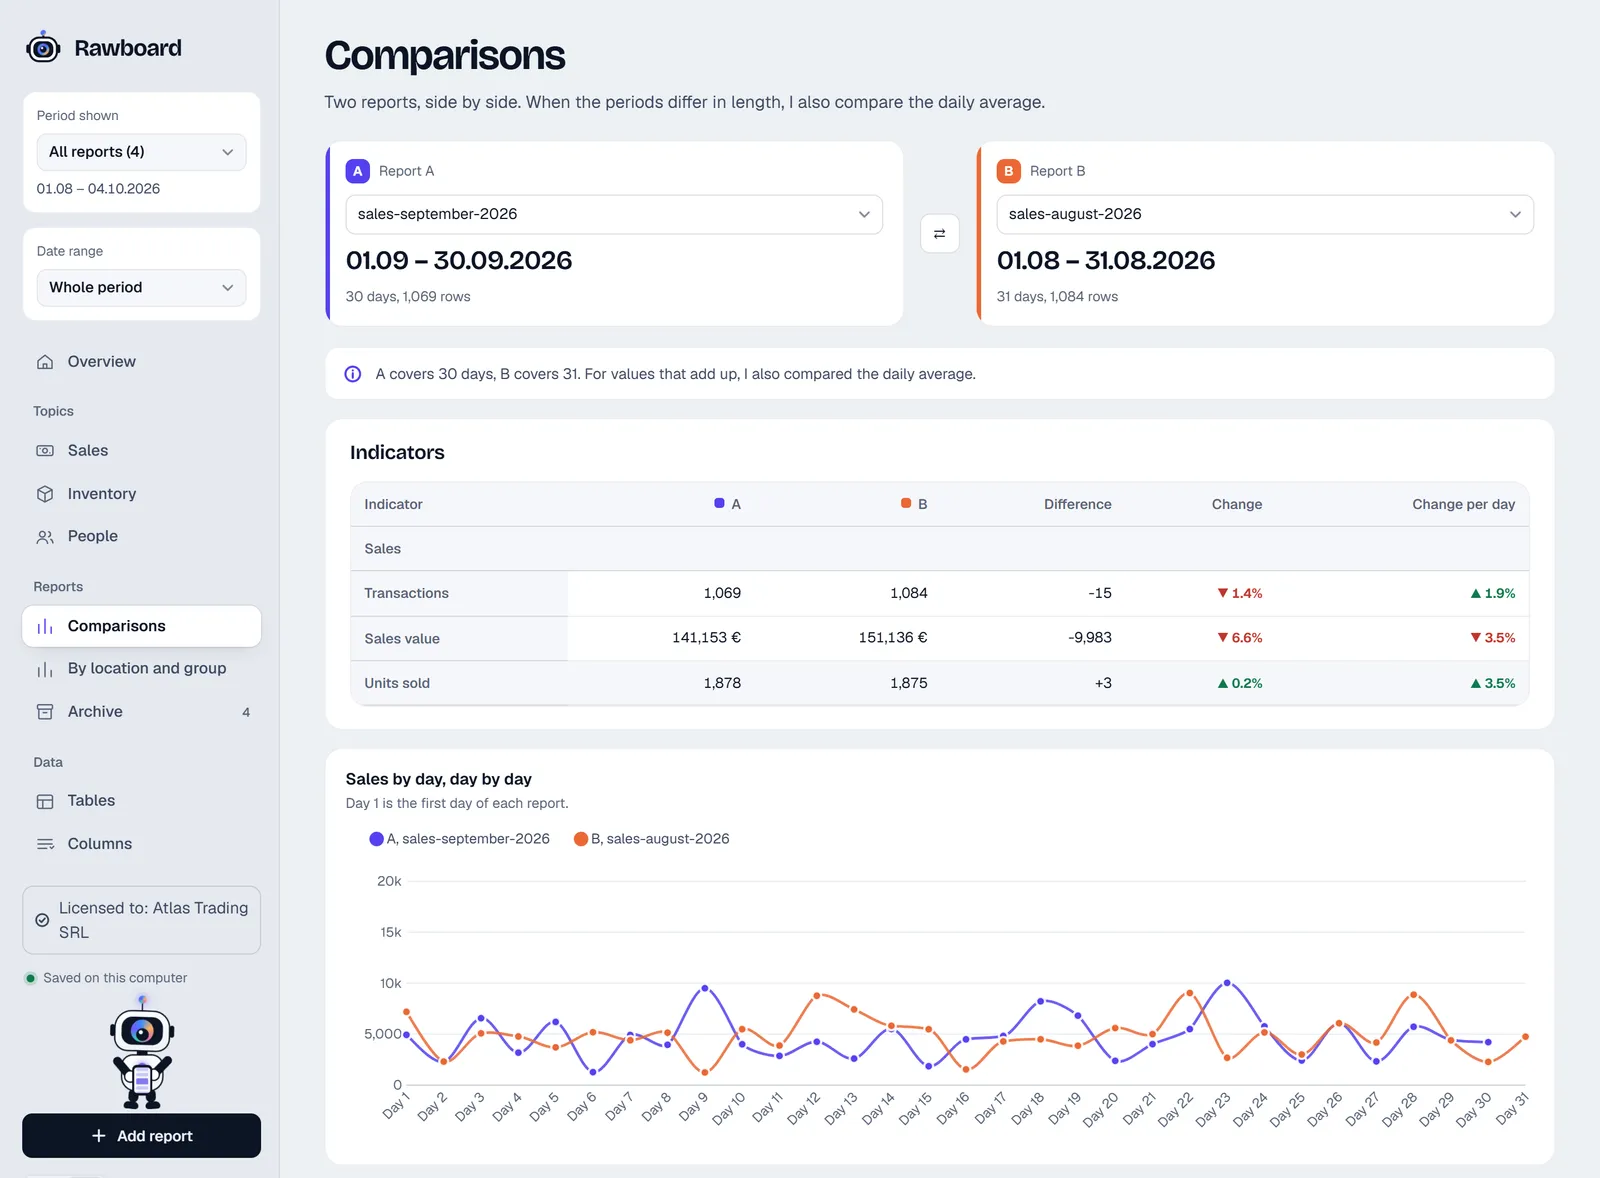
The archive is tied to the browser and to the file location: keep the Rawboard file in one place and download a backup regularly. More indicators worth tracking: seven monthly indicators for an optical store.
Frequently asked questions
Why can I not directly compare a 31-day month with a 30-day one?
How do I compare this month with the same month last year?
Can I compare a partial period with a full month?
Does Rawboard keep old reports?
Sources and further reading

Optometrist with over ten years in medical optics. Writes about what works in a real practice or shop, and builds the apps that daily work called for.
About the author